Create Chicklet (Rounded Segmented Column) Charts
https://cinc.rud.is/web/packages/ggchicklet/
You can not select more than 25 topics
Topics must start with a letter or number, can include dashes ('-') and can be up to 35 characters long.
|
|
4 years ago | |
|---|---|---|
| R | 5 years ago | |
| data | 4 years ago | |
| data-raw | 4 years ago | |
| inst/tinytest | 5 years ago | |
| man | 4 years ago | |
| tests | 5 years ago | |
| vignettes | 5 years ago | |
| .Rbuildignore | 5 years ago | |
| .codecov.yml | 5 years ago | |
| .gitignore | 5 years ago | |
| .travis.yml | 5 years ago | |
| CONDUCT.md | 5 years ago | |
| DESCRIPTION | 4 years ago | |
| LICENSE | 5 years ago | |
| NAMESPACE | 5 years ago | |
| NEWS.md | 4 years ago | |
| README.Rmd | 5 years ago | |
| README.md | 4 years ago | |
| ggchicklet.Rproj | 5 years ago | |
README.md

![]()
![]()

![]()
![]()
![]()
ggchicklet
Create Chicklet (Rounded Segmented Column) Charts
Description
Sometimes it is useful to stylize column charts a bit more than just bland rectangles. Methods are provided to create rounded rectangle segmented column charts (i.e. “chicklets”).
What’s Inside The Tin
debates2019: 2019-2020 U.S. Democratic Debate Candidate/Topic Timesgeom_chicklet: Chicklet (rounded segmented column) charts
The following functions are implemented:
Installation
install.packages("ggchicklet", repos = "https://cinc.rud.is")
# or
remotes::install_git("https://git.rud.is/hrbrmstr/ggchicklet.git")
# or
remotes::install_git("https://git.sr.ht/~hrbrmstr/ggchicklet")
# or
remotes::install_gitlab("hrbrmstr/ggchicklet")
# or
remotes::install_bitbucket("hrbrmstr/ggchicklet")
# or
remotes::install_github("hrbrmstr/ggchicklet")
NOTE: To use the ‘remotes’ install options you will need to have the {remotes} package installed.
Usage
library(ggchicklet)

# current version
packageVersion("ggchicklet")
## [1] '0.4.0'
From the NYTimes
library(hrbrthemes)
library(tidyverse)
data("debates2019")
debates2019 %>%
filter(debate_group == 1) %>%
mutate(speaker = fct_reorder(speaker, elapsed, sum, .desc=FALSE)) %>%
mutate(topic = fct_other(
topic,
c("Immigration", "Economy", "Climate Change", "Gun Control", "Healthcare", "Foreign Policy"))
) %>%
ggplot(aes(speaker, elapsed, group = timestamp, fill = topic)) +
geom_chicklet(width = 0.75) +
scale_y_continuous(
expand = c(0, 0.0625),
position = "right",
breaks = seq(0, 14, 2),
labels = c(0, sprintf("%d min.", seq(2, 14, 2)))
) +
scale_fill_manual(
name = NULL,
values = c(
"Immigration" = "#ae4544",
"Economy" = "#d8cb98",
"Climate Change" = "#a4ad6f",
"Gun Control" = "#cc7c3a",
"Healthcare" = "#436f82",
"Foreign Policy" = "#7c5981",
"Other" = "#cccccc"
),
breaks = setdiff(unique(debates2019$topic), "Other")
) +
guides(
fill = guide_legend(nrow = 1)
) +
coord_flip() +
labs(
x = NULL, y = NULL, fill = NULL,
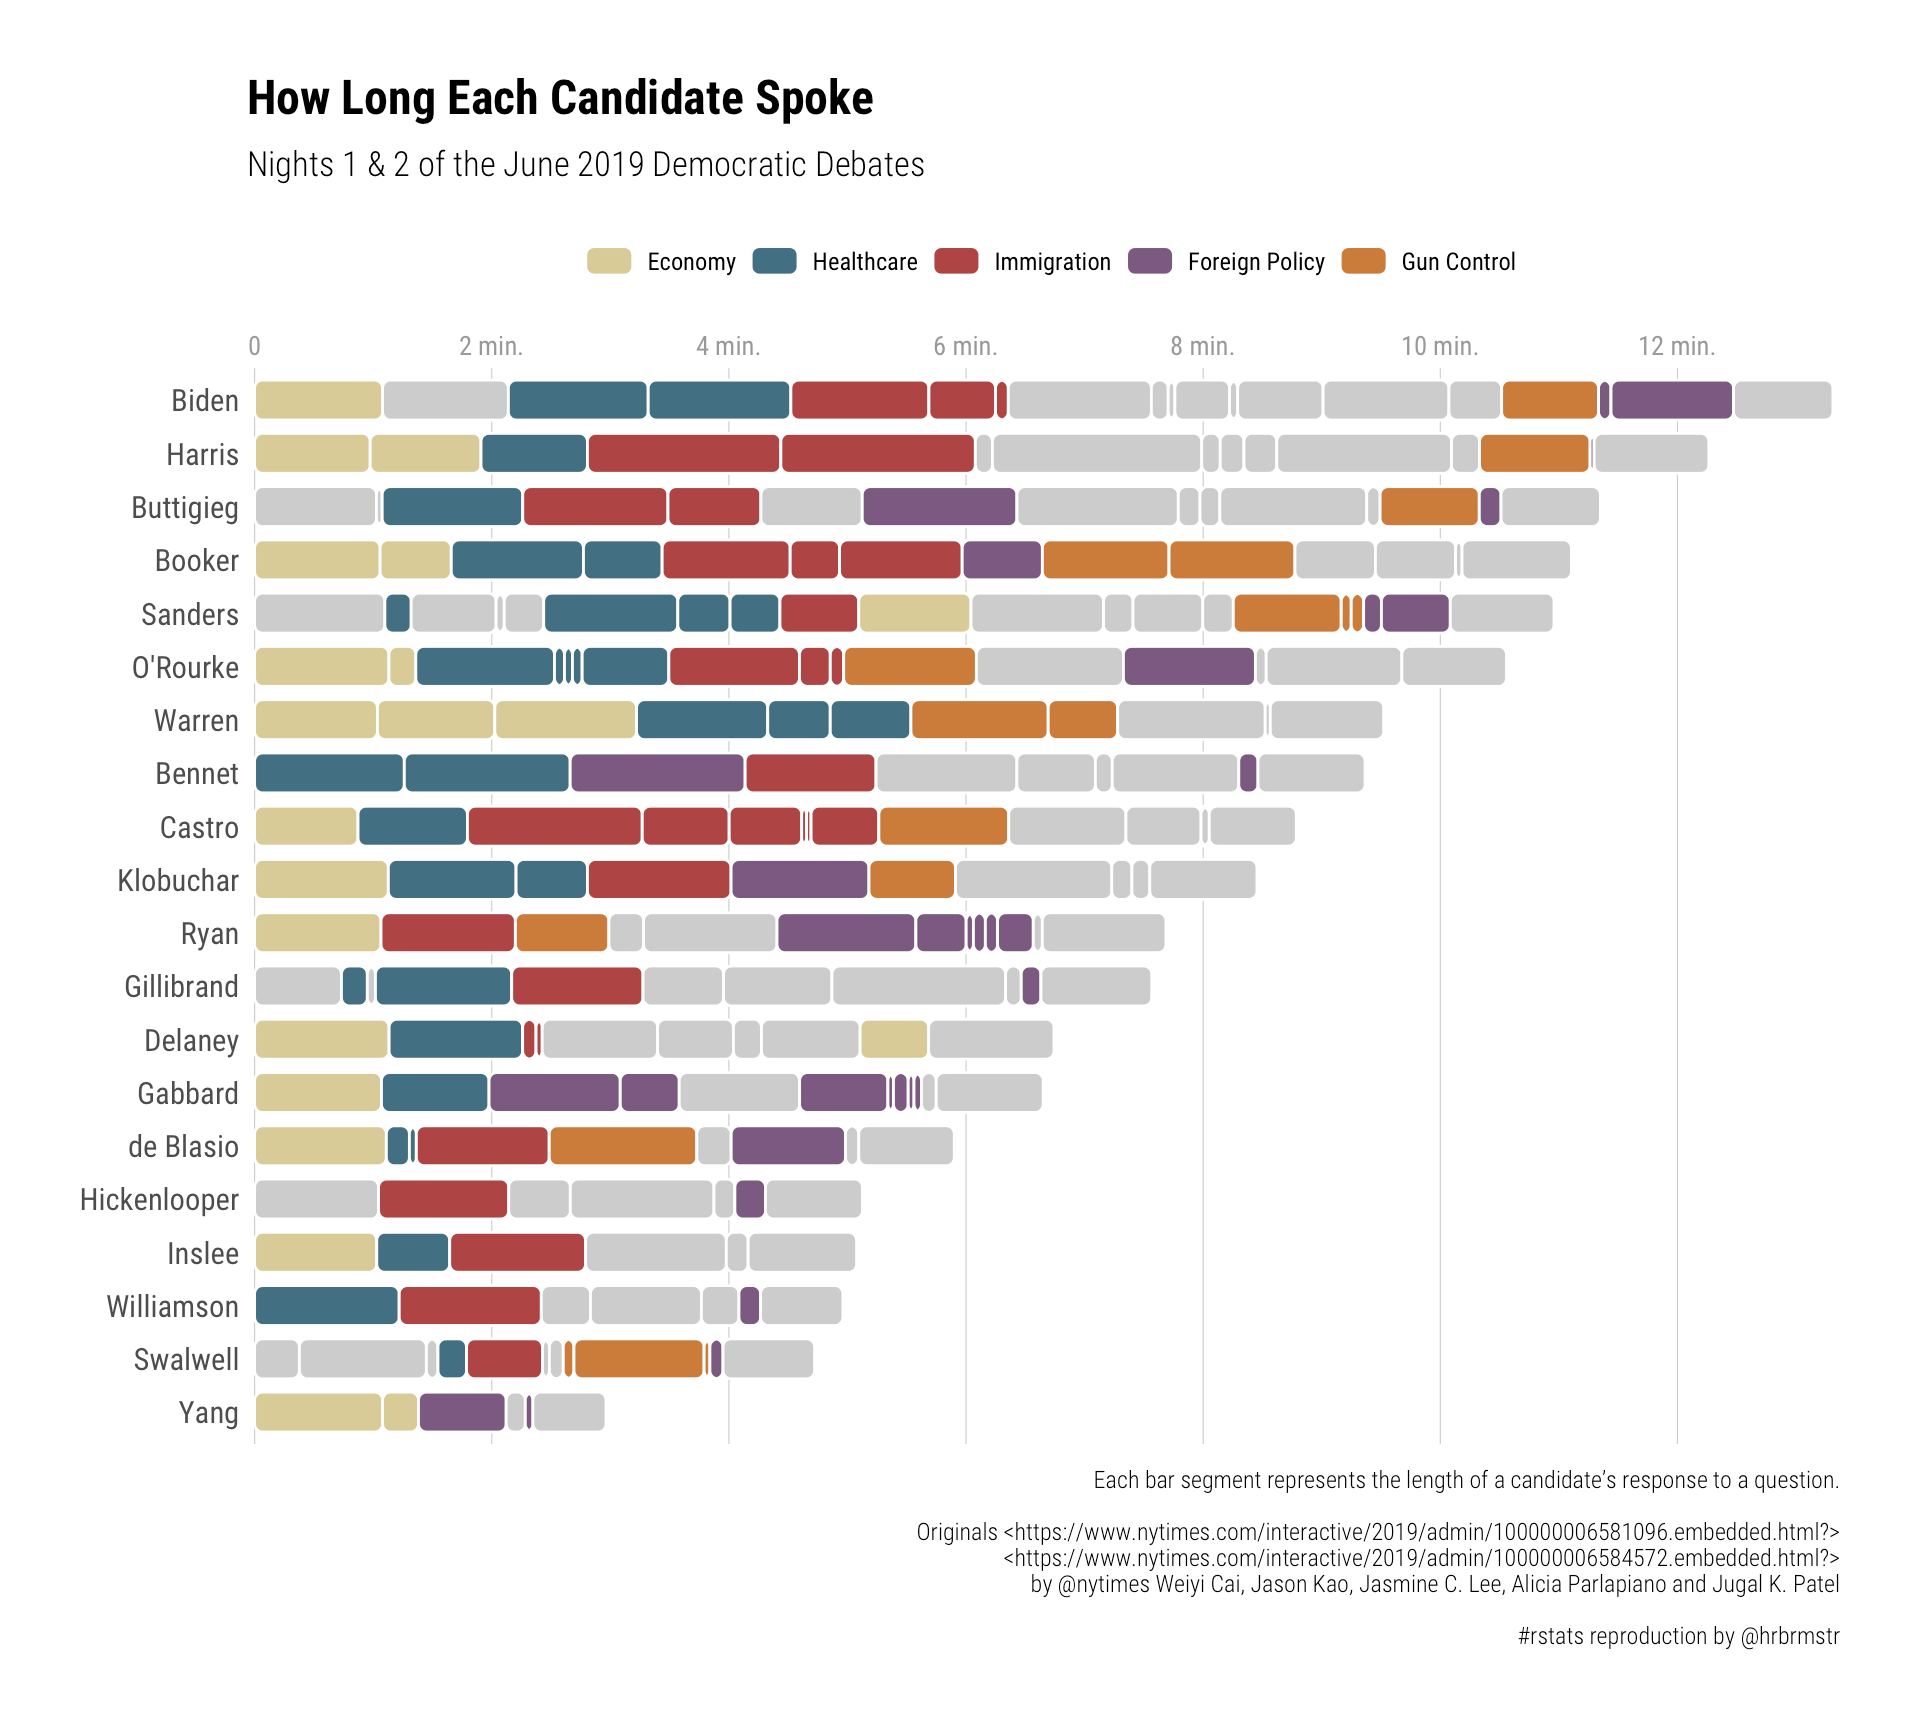
title = "How Long Each Candidate Spoke",
subtitle = "Nights 1 & 2 of the June 2019 Democratic Debates",
caption = "Each bar segment represents the length of a candidate’s response to a question.\n\nOriginals <https://www.nytimes.com/interactive/2019/admin/100000006581096.embedded.html?>\n<https://www.nytimes.com/interactive/2019/admin/100000006584572.embedded.html?>\nby @nytimes Weiyi Cai, Jason Kao, Jasmine C. Lee, Alicia Parlapiano and Jugal K. Patel\n\n#rstats reproduction by @hrbrmstr"
) +
theme_ipsum_rc(grid="X") +
theme(axis.text.x = element_text(color = "gray60", size = 10)) +
theme(legend.position = "top")
ggchicklet Metrics
| Lang | # Files | (%) | LoC | (%) | Blank lines | (%) | # Lines | (%) |
|---|---|---|---|---|---|---|---|---|
| HTML | 9 | 0.47 | 9049 | 0.93 | 2564 | 0.97 | 387 | 0.65 |
| R | 8 | 0.42 | 575 | 0.06 | 38 | 0.01 | 122 | 0.21 |
| Rmd | 2 | 0.11 | 117 | 0.01 | 45 | 0.02 | 85 | 0.14 |
Code of Conduct
Please note that this project is released with a Contributor Code of Conduct. By participating in this project you agree to abide by its terms.