You can not select more than 25 topics
Topics must start with a letter or number, can include dashes ('-') and can be up to 35 characters long.
2.6 KiB
2.6 KiB

![]()
gglogspline
A ‘ggplot2’ Extension for Visualizing Density, Distribution, Hazard, or Survival Functions using the ‘logspline’ Package
Description
Methods are provided to plot a logspline density, distribution function, hazard function or survival function from a logspline density
What’s Inside The Tin
The following functions are implemented:
Installation
devtools::install_git("https://git.sr.ht/~hrbrmstr/gglogspline.git")
# or
devtools::install_git("https://git.rud.is/hrbrmstr/gglogspline.git")
# or
devtools::install_gitlab("hrbrmstr/gglogspline")
# or
devtools::install_bitbucket("hrbrmstr/gglogspline")
# or
devtools::install_github("hrbrmstr/gglogspline")
Usage
library(gglogspline)
library(ggplot2)

# current version
packageVersion("gglogspline")
## [1] '0.1.0'
set.seed(1)
data.frame(
  val = rnorm(100)
) -> xdf

ggplot(xdf) +
  stat_logspline(aes(val))

ggplot(xdf) +
  stat_logspline(aes(val, y = stat(count))) +
  labs(title = "logspline (count)")

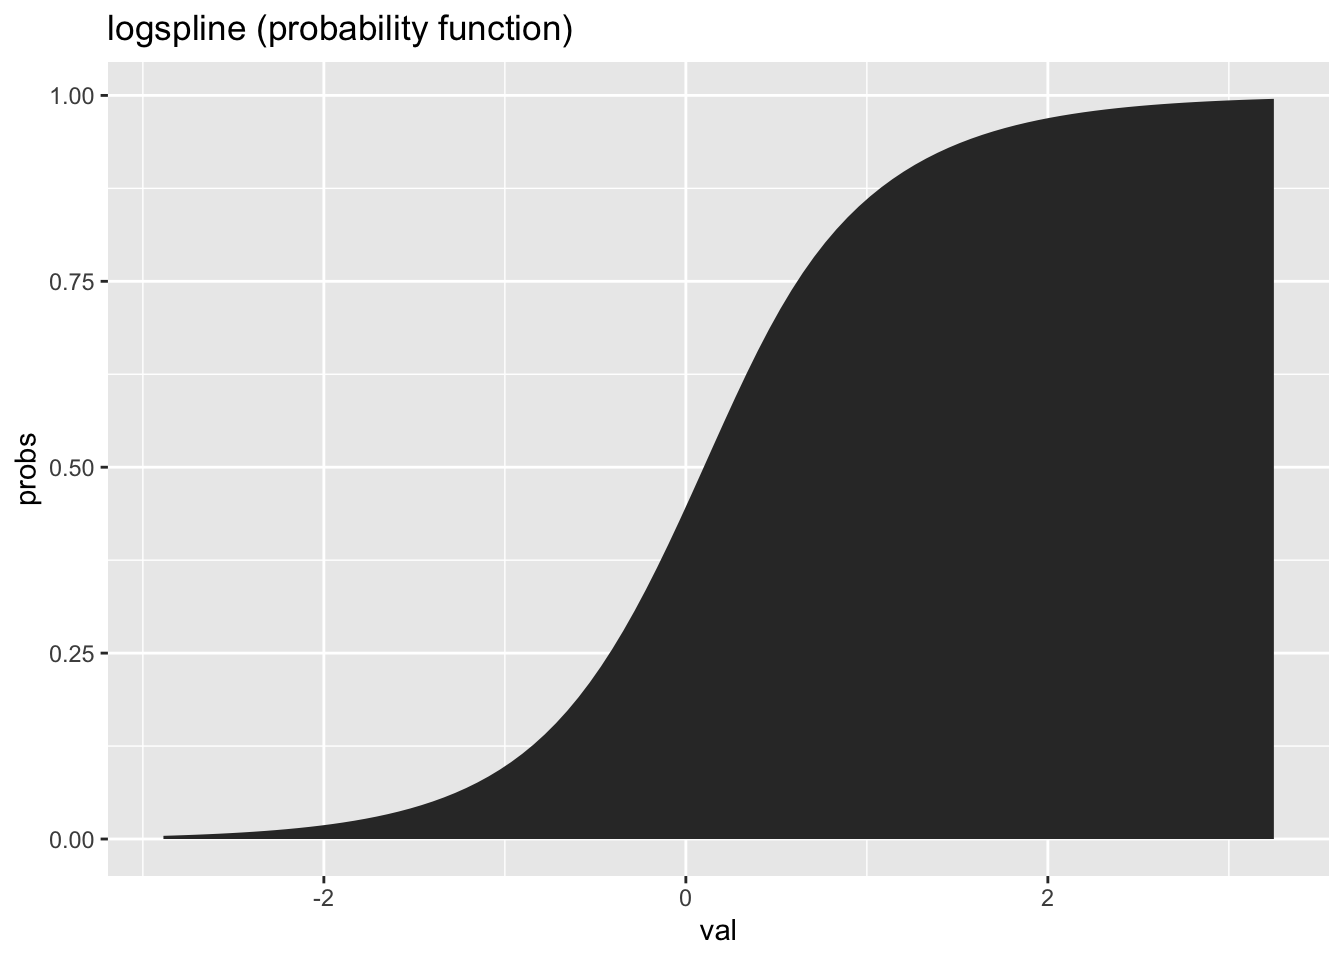
ggplot(xdf) +
  stat_logspline(aes(val, y = stat(probs))) +
  labs(title = "logspline (probability function)")
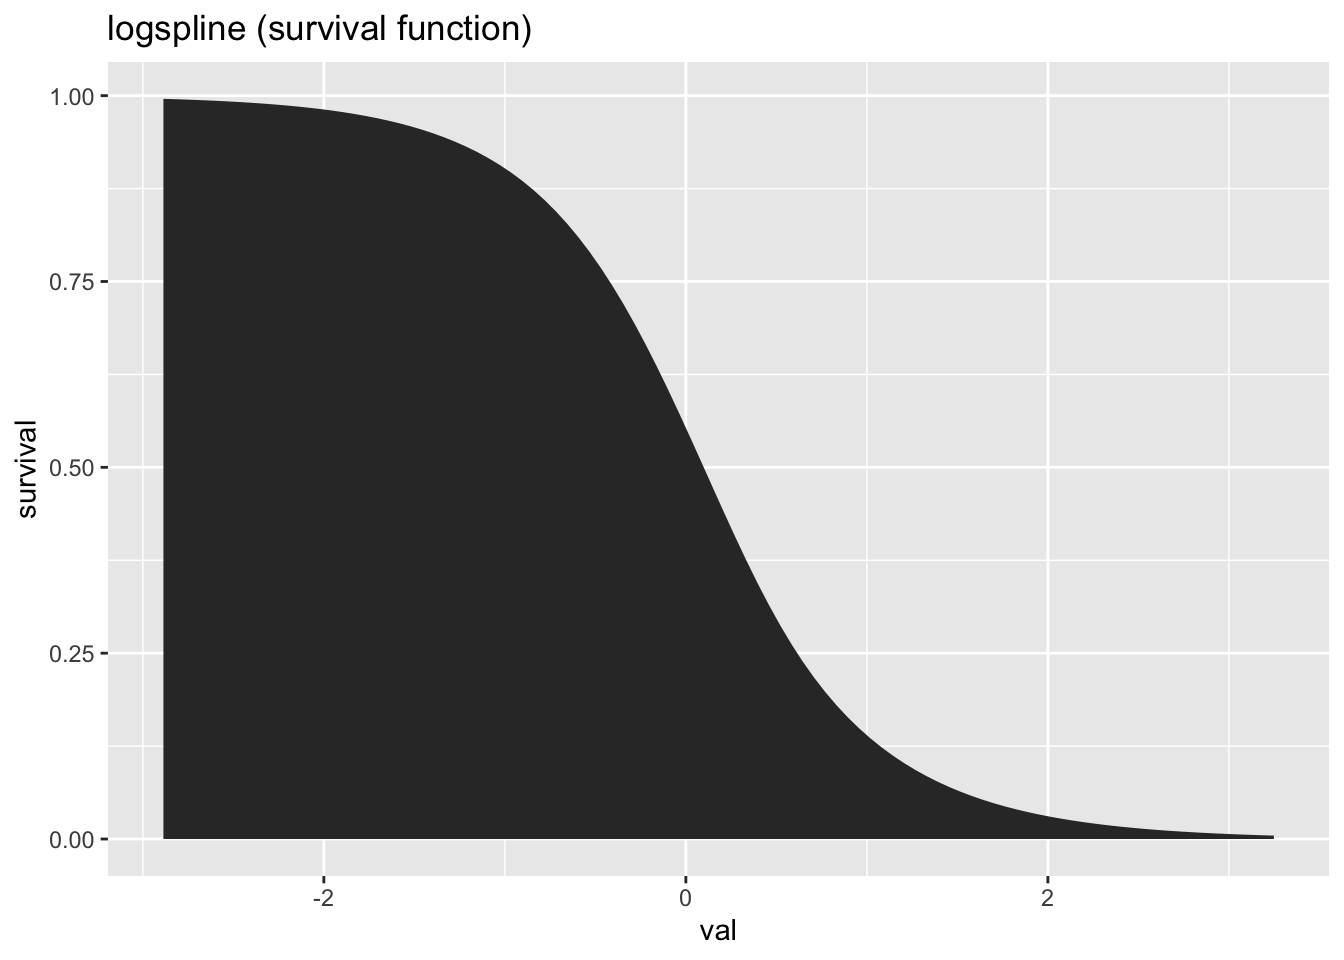
ggplot(xdf) +
  stat_logspline(aes(val, y = stat(survival))) +
  labs(title = "logspline (survival function)")
ggplot(xdf) +
  stat_logspline(aes(val, y = stat(hazard))) +
  labs(title = "logspline (hazard function)")

gglogspline Metrics
| Lang | # Files | (%) | LoC | (%) | Blank lines | (%) | # Lines | (%) |
|---|---|---|---|---|---|---|---|---|
| R | 4 | 0.8 | 63 | 0.67 | 20 | 0.47 | 53 | 0.6 |
| Rmd | 1 | 0.2 | 31 | 0.33 | 23 | 0.53 | 35 | 0.4 |
Code of Conduct
Please note that this project is released with a Contributor Code of Conduct. By participating in this project you agree to abide by its terms.