|
|
7 years ago | |
|---|---|---|
| R | 7 years ago | |
| README_files/figure-markdown_github | 7 years ago | |
| man | 7 years ago | |
| tests | 7 years ago | |
| .Rbuildignore | 7 years ago | |
| .gitignore | 7 years ago | |
| .travis.yml | 7 years ago | |
| CONDUCT.md | 7 years ago | |
| DESCRIPTION | 7 years ago | |
| NAMESPACE | 7 years ago | |
| NEWS.md | 7 years ago | |
| README.Rmd | 7 years ago | |
| README.md | 7 years ago | |
| hrbrthemes.Rproj | 7 years ago | |
README.md
hrbrthemes : Additional Themes and Theme Components for 'ggplot2'
This is a very focused package that provides typography-centric themes and theme components for ggplot2. It's a an extract/riff of hrbrmisc created by request.
The core theme: theme_ipsum ("ipsum" is Latin for "precise") uses Arial Narrow which should be installed on practically any modern system, so it's "free"-ish. This font is condensed, has solid default kerning pairs and geometric numbers. That's what I consider the "font trifecta" must-have for charts. An additional quality for fonts for charts is that they have a diversity of weights. Arial Narrow (the one on most systems, anyway) does not have said diversity but this quality is not (IMO) a "must have".
The following functions are implemented/objects are exported:
theme_ipsum: Arial Narrow-based themeupdate_geom_font_defaults: Update matching font defaults for text geoms (the default is — unsurprisingly — Arial Narrow)scale_x_comma/scale_y_comma: Comma format for axis text andexpand=c(0,0)(you need to set limits)scale_x_percent/scale_y_percent: Percent format for axis text andexpand=c(0,0)(you need to set limits)font_an: a short global alias for "Arial Narrow"
TODO
- Creation of supplemental extra font packages with instructions for installation
- Additional base themes to match ^^
- At least one new custom color & fill scale
- Whatever ends up in a feature request in an issue that makes sense ;-)
Installation
devtools::install_github("hrbrmstr/hrbrthemes")
options(width=120)
Usage
library(hrbrthemes)
library(tidyverse)

# current verison
packageVersion("hrbrthemes")
## [1] '0.1.0'
Base theme (Arial Narrow)
ggplot(mtcars, aes(mpg, wt)) +
  geom_point() +
  labs(x="Fuel effiiency (mpg)", y="Weight (tons)",
       title="Seminal ggplot2 scatterplot example",
       subtitle="A plot that is only useful for demonstration purposes",
       caption="Brought to you by the letter 'g'") +
  theme_ipsum()

Scales
count(mpg, class) %>%
  mutate(pct=n/sum(n)) %>%
  ggplot(aes(class, pct)) +
  geom_col() +
  scale_y_percent() +
  labs(x="Fuel effiiency (mpg)", y="Weight (tons)",
       title="Seminal ggplot2 column chart example with percents",
       subtitle="A plot that is only useful for demonstration purposes",
       caption="Brought to you by the letter 'g'") +
  theme_ipsum(grid="Y")

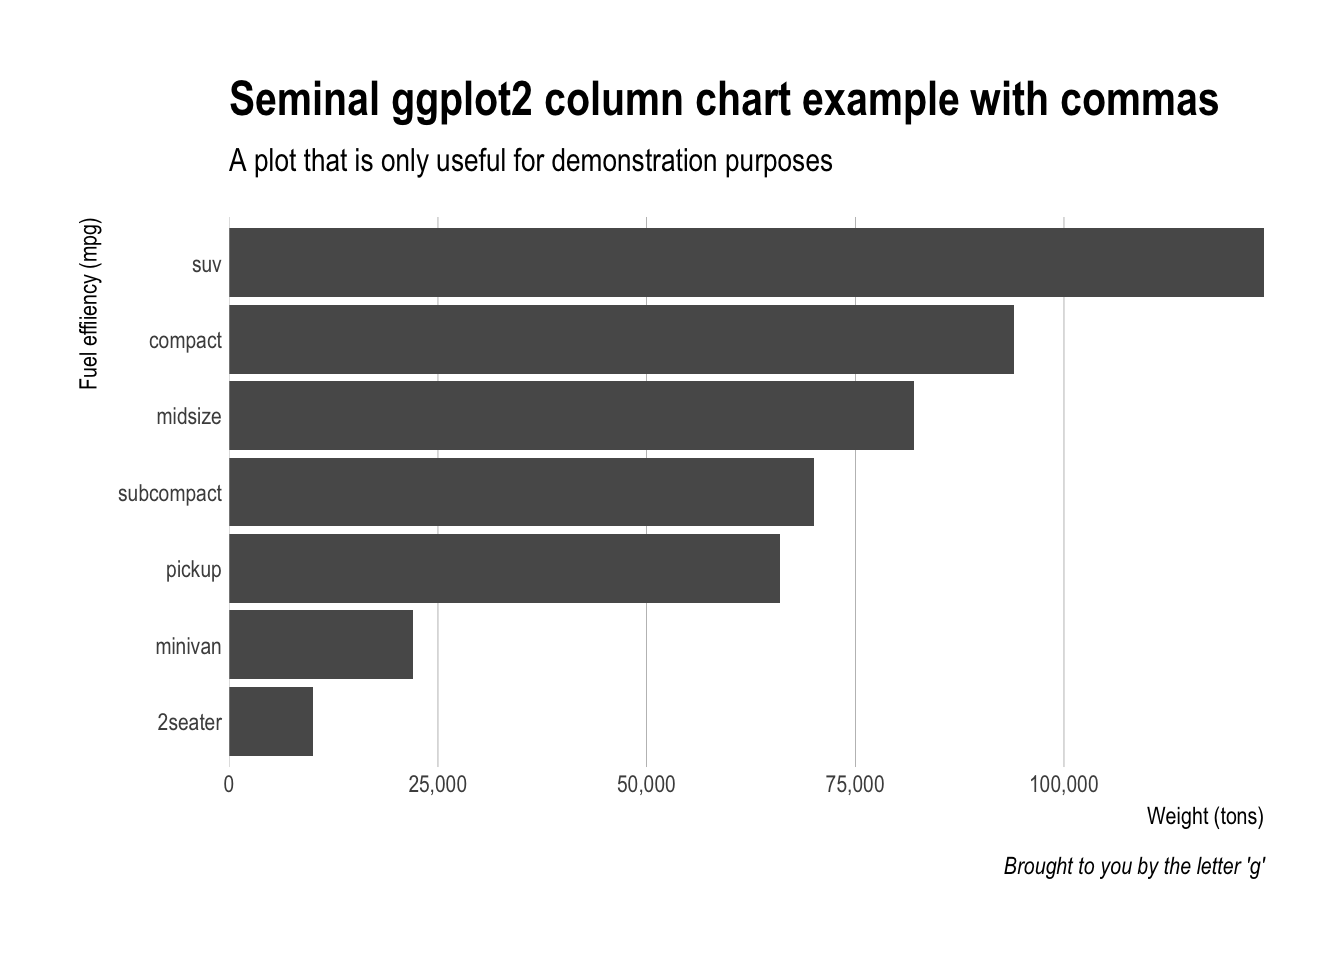
count(mpg, class) %>%
  mutate(n=n*2000) %>%
  arrange(n) %>%
  mutate(class=factor(class, levels=class)) %>%
  ggplot(aes(class, n)) +
  geom_col() +
  scale_y_comma() +
  coord_flip() +
  labs(x="Fuel effiiency (mpg)", y="Weight (tons)",
       title="Seminal ggplot2 column chart example with commas",
       subtitle="A plot that is only useful for demonstration purposes",
       caption="Brought to you by the letter 'g'") +
  theme_ipsum(grid="X")
Test Results
library(hrbrthemes)
library(testthat)

date()
## [1] "Sat Feb 11 12:01:25 2017"
test_dir("tests/")
## testthat results ========================================================================================================
## OK: 0 SKIPPED: 0 FAILED: 0
##
## DONE ===================================================================================================================
Code of Conduct
Please note that this project is released with a Contributor Code of Conduct. By participating in this project you agree to abide by its terms.