You can not select more than 25 topics
Topics must start with a letter or number, can include dashes ('-') and can be up to 35 characters long.
3.9 KiB
3.9 KiB
statebins
Create ‘U.S.’ Uniform Square State Cartogram Heatmaps
What’s in the tin?
The following functions are implemented:
statebins: Creates “statebin” charts in the style of http://bit.ly/statebinstheme_statebins: Base statebins theme
Installation
devtools::install_github("hrbrmstr/statebins")
Usage
All of the following examples use the WaPo data. It looks like the columns they use are scaled data and I didn’t take the time to figure out what they did, so the final figure just mimics their output (including the non-annotated legend).
library(statebins)
library(tidyverse)

# current verison
packageVersion("statebins")
## [1] '1.3.0'
# the original wapo data

adat <- suppressMessages(read_csv("http://www.washingtonpost.com/wp-srv/special/business/states-most-threatened-by-trade/states.csv?cache=1"))

mutate(
  adat,
  share = cut(avgshare94_00, breaks = 4, labels = c("0-1", "1-2", "2-3", "3-4"))
) %>%
  statebins(
    value_col = "share",
    ggplot2_scale_function = scale_fill_brewer,
    name = "Share of workforce with jobs lost or threatened by trade"
  ) +
  labs(title = "1994-2000") +
  theme_statebins()

# continuous scale, legend on top

statebins(
  adat, value_col = "avgshare01_07",
  name = "Share of workforce with jobs lost or threatened by trade",
  palette = "OrRd", direction = 1
) +
  labs(x="2001-2007") +
  theme_statebins(legend_position="top")

# continuous scale, no legend

statebins(adat, value_col = "avgshare08_12", palette = "Purples") +
  labs(x="2008-2010") +
  theme_statebins(legend_position = "none")

# mortality data (has Puerto Rico)
# from: http://www.cdc.gov/nchs/fastats/state-and-territorial-data.htm

dat <- suppressMessages(read_csv("http://datadrivensecurity.info/data/deaths.csv"))

statebins(dat, value_col = "death_rate", name="Per 100K pop") +
  labs(title="Mortality Rate (2010)") +
  theme_statebins()

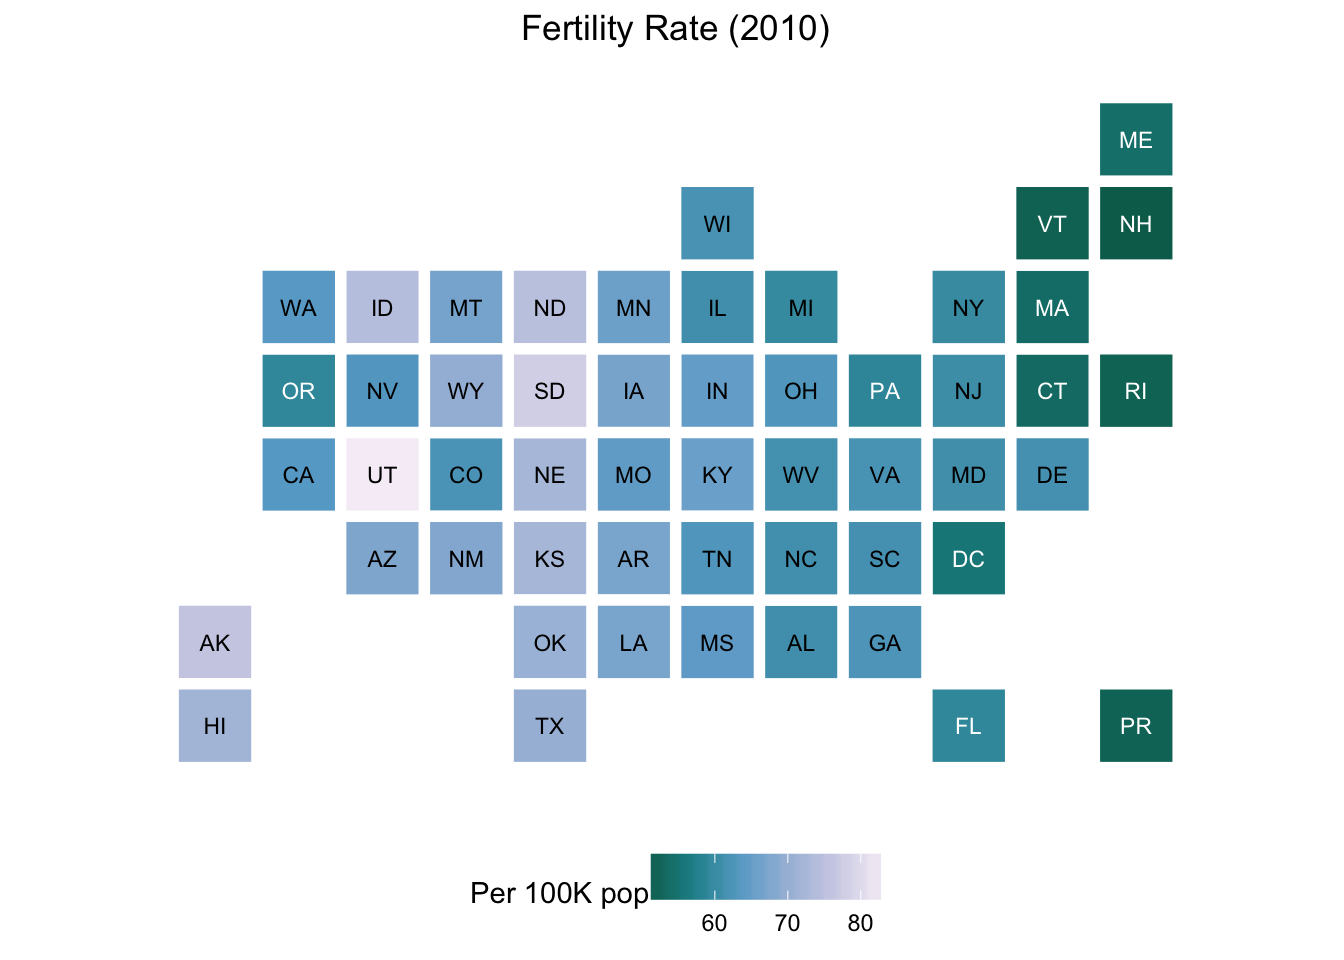
# fertility data

statebins(dat, value_col="fertility_rate", name="Per 100K pop", palette="PuBuGn") +
  labs(title="Fertility Rate (2010)") +
  theme_statebins()
# manual - perhaps good for elections?

election_2012 <- suppressMessages(read_csv("https://raw.githubusercontent.com/hrbrmstr/statebins/master/tmp/election2012.csv"))

mutate(election_2012, value = ifelse(is.na(Obama), "Romney", "Obama")) %>%
  statebins(
    font_size=4, dark_label = "white", light_label = "white",
    ggplot2_scale_function = scale_fill_manual,
    name = "Winner",
    values = c(Romney = "#2166ac", Obama = "#b2182b")
  ) +
  theme_statebins()

All the “states”
statebins now has PR, VI & NYC (by name or abbreviation) so you can
use them, too:
library(statebins)
library(tidyverse)
library(viridis)

data(USArrests)

# make up some data for the example

rownames_to_column(USArrests, "state") %>%
  bind_rows(
    data_frame(
      state = c("Virgin Islands", "Puerto Rico", "New York City"),
      Murder = rep(mean(max(USArrests$Murder),3)),
      Assault = rep(mean(max(USArrests$Assault),3)),
      Rape = rep(mean(max(USArrests$Rape),3)),
      UrbanPop = c(93, 95, 100)
    )
  ) -> us_arrests

statebins(us_arrests, value_col="Assault",
          ggplot2_scale_function = viridis::scale_fill_viridis) +
  labs(title="USArrests + made up data") +
  theme_statebins("right")
