You can not select more than 25 topics
Topics must start with a letter or number, can include dashes ('-') and can be up to 35 characters long.
|
|
10 years ago | |
|---|---|---|
| R | 10 years ago | |
| _README_files/figure-markdown_github | 10 years ago | |
| data | 10 years ago | |
| man | 10 years ago | |
| tests | 10 years ago | |
| .Rbuildignore | 10 years ago | |
| .gitignore | 10 years ago | |
| .travis.yml | 10 years ago | |
| DESCRIPTION | 10 years ago | |
| LICENSE | 10 years ago | |
| NAMESPACE | 10 years ago | |
| README.md | 10 years ago | |
| _README.Rmd | 10 years ago | |
| statebins.Rproj | 10 years ago | |
README.md
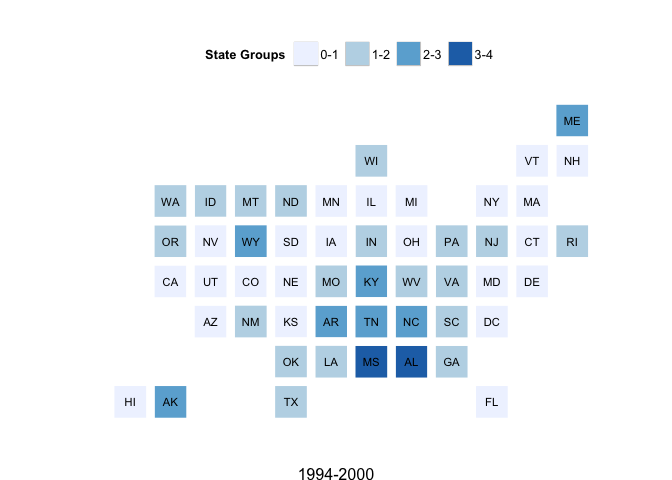
statebins is an alternative to choropleth maps for US States
The following functions are implemented:
statebins-statebins_continuous-
News
- Version
1.0.0released
Installation
devtools::install_github("hrbrmstr/statebins")
Usage
library(statebins)

# current verison
packageVersion("statebins")
## [1] '1.0'
# the original wapo data

dat <- read.csv("http://www.washingtonpost.com/wp-srv/special/business/states-most-threatened-by-trade/states.csv?cache=1", stringsAsFactors=FALSE)

gg <- statebins(dat, "state", "avgshare94_00", breaks=4,
                labels=c("0-1", "1-2", "2-3", "3-4"),
                legend_title="State Groups", font_size=3,
                brewer_pal="Blues", text_color="black",
                plot_title="1994-2000", title_position="bottom")

gg
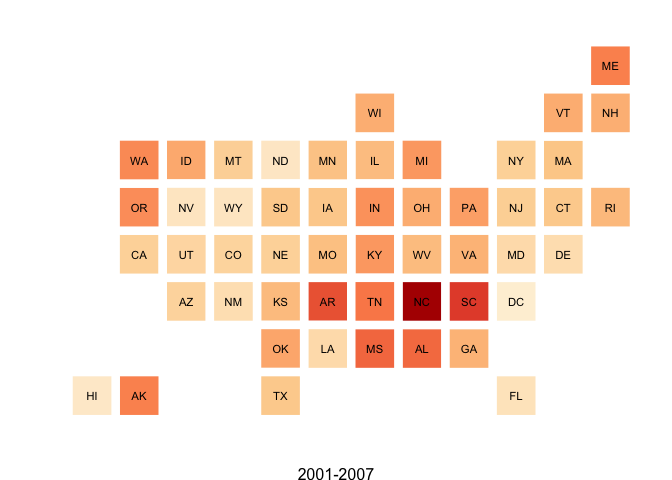
gg2 <- statebins_continuous(dat, "state", "avgshare01_07",
                legend_title="States", legend_position="none",
                brewer_pal="OrRd", text_color="black", font_size=3,
                plot_title="2001-2007", title_position="bottom")

gg2
gg3 <- statebins_continuous(dat, "state", "avgshare08_12",
                legend_title="States", legend_position="none",
                brewer_pal="Purples", text_color="black", font_size=3,
                plot_title="2008-2012", title_position="bottom")

gg3

Test Results
library(statebins)
library(testthat)

date()
## [1] "Mon Aug 25 22:36:21 2014"
test_dir("tests/")
## basic functionality :