You can not select more than 25 topics
Topics must start with a letter or number, can include dashes ('-') and can be up to 35 characters long.
|
|
10 years ago | |
|---|---|---|
| R | 10 years ago | |
| _README_files/figure-markdown_github | 10 years ago | |
| data | 10 years ago | |
| man | 10 years ago | |
| tests | 10 years ago | |
| tmp | 10 years ago | |
| .Rbuildignore | 10 years ago | |
| .gitignore | 10 years ago | |
| .travis.yml | 10 years ago | |
| DESCRIPTION | 10 years ago | |
| LICENSE | 10 years ago | |
| NAMESPACE | 10 years ago | |
| README.md | 10 years ago | |
| _README.Rmd | 10 years ago | |
| statebins.Rproj | 10 years ago | |
README.md
statebins is an alternative to choropleth maps for US States
The following functions are implemented:
statebins- creates "statebin" charts in the style of http://bit.ly/statebins - This version uses discreteRColorBrewerscales, binned by the "breaks" parameter.statebins_continuous- creates "statebin" charts in the style of http://bit.ly/statebins - This version uses a continuous scale based onRColorBrewerscales (passing in a 6 elementRColorBrewerpalette toscale_fill_gradientn).
TODO
- The current version is usable, but I think the plot margins and the legends need work
- Apply algorithm to switch to light-on-dark depending on the background tile color
News
- Version
1.0.0released
Installation
devtools::install_github("hrbrmstr/statebins")
Usage
All of the following examples use the WaPo data. It looks like the colums they use are scaled data and I didn't take the time to figure out what they did, so the final figure just mimics their output (including the non-annotated legend).
library(statebins)

# current verison
packageVersion("statebins")
## [1] '1.0'
# the original wapo data
dat <- read.csv("http://www.washingtonpost.com/wp-srv/special/business/states-most-threatened-by-trade/states.csv?cache=1", stringsAsFactors=FALSE)
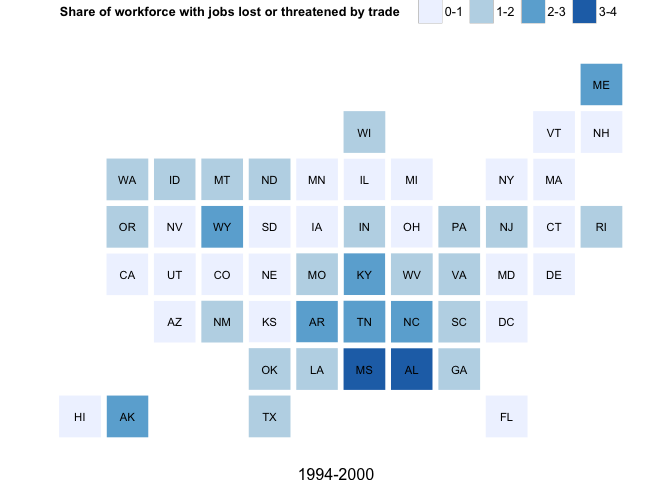
gg <- statebins(dat, "state", "avgshare94_00", breaks=4,
labels=c("0-1", "1-2", "2-3", "3-4"),
legend_title="Share of workforce with jobs lost or threatened by trade", font_size=3,
brewer_pal="Blues", text_color="black",
plot_title="1994-2000", title_position="bottom")
gg
# continuous scale, legend on top
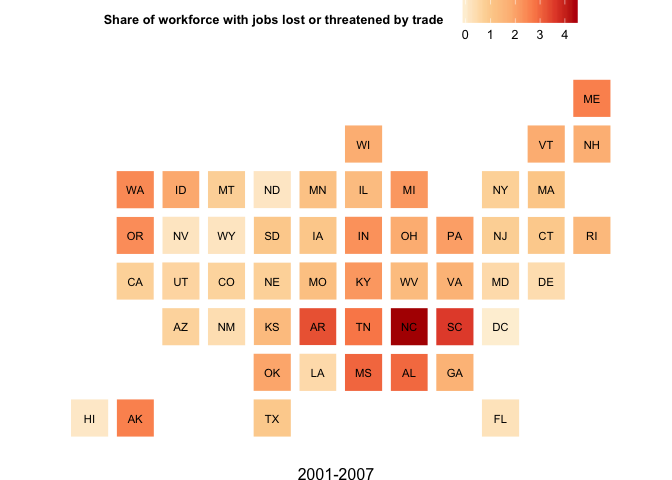
gg2 <- statebins_continuous(dat, "state", "avgshare01_07",
legend_title="Share of workforce with jobs lost or threatened by trade", legend_position="top",
brewer_pal="OrRd", text_color="black", font_size=3,
plot_title="2001-2007", title_position="bottom")
gg2
# continuous scale, no legend
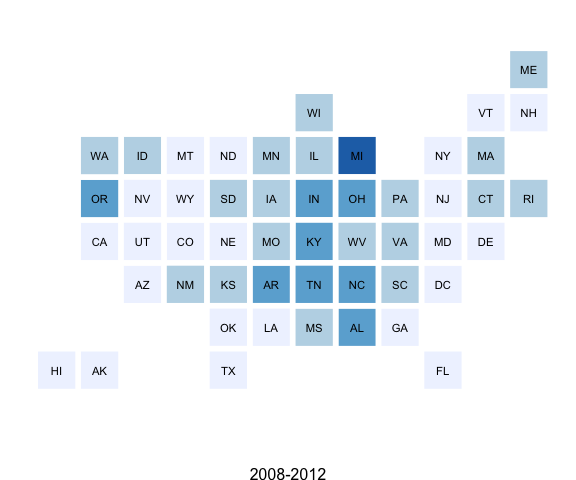
gg3 <- statebins_continuous(dat, "state", "avgshare08_12",
legend_title="States", legend_position="none",
brewer_pal="Purples", text_color="black", font_size=3,
plot_title="2008-2012", title_position="bottom")
gg3

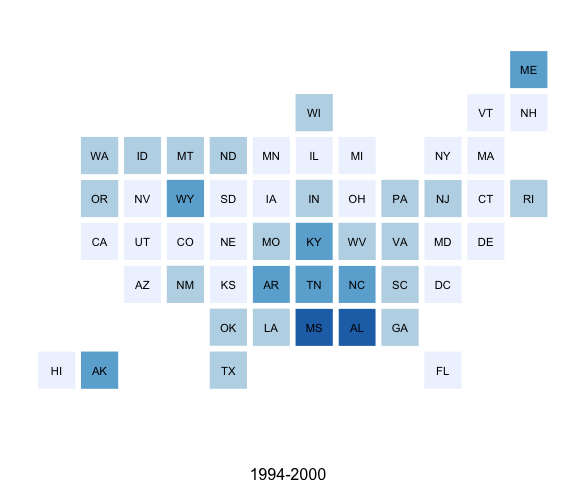
# or, more like the one in the WaPo article; i might be picking the wrong columns here. it's just for an example

sb <- function(col, title) {
  statebins(dat, "state",col, brewer_pal="Blues", text_color="black", legend_position="none", font_size=3, plot_title=title, breaks=4, labels=1:4)
}
# cheating and using <table> to arrange them below and also making a WaPo-like legend,
# since mucking with grid graphics margins/padding was not an option time-wise at the moment

sb("avgshare94_00", "1994-2000")
sb("avgshare01_07", "2001-2007")
sb("avgshare08_12", "2008-2012")
Share of workforce with jobs lost or threatened by trade
| Smallest share | Largest | ||
|
|
|
|
|

And, we'll throw in a gratuitous animation for good measure:
# data set from StatsAmerica - http://www.statsamerica.org/profiles/sip_index.html

# median household income from the ACS survey
miacs <- read.csv("http://dds.ec/data/median-income-acs.csv", header=TRUE, stringsAsFactors=FALSE)

# generate frames based on year
sapply(unique(miacs$year), function(year) {

  png(file=sprintf("tmp/household%d.png", year),
      type="quartz", antialias="subpixel", width=800, height=600)

  rng <- floor(range(miacs[miacs$year==year,]$mh_inc))

  ggtmp <- statebins(miacs[miacs$year==year,], "state", "mh_inc",
                   legend_title="States", legend_position="none",
                   brewer_pal="Greens", text_color="black", font_size=3,
                   plot_title=sprintf("Median Household Income (ACS) %d\n$%s - $%s", year, comma(rng[1]), comma(rng[2])), title_position="top")

  print(ggtmp)

  dev.off()

})

# animate them with ImageMagick
system("convert -delay 100 -loop 1 tmp/house*.png tmp/household.mov")
Test Results
library(statebins)
library(testthat)

date()
## [1] "Tue Aug 26 15:21:25 2014"
test_dir("tests/")
## basic functionality :